


If you’ve been a real estate decision-maker for a while, you’ve made mistakes.
But as an industry, we don’t like looking at those mistakes.
Nothing to see here.
But sometimes it’s worth diving into those mistakes.
Not to rub salt in anyone’s wounds, but to understand what happened, what didn’t happen, and what’s likely to happen going forward.
Why is CRE stuck in the mud?
Lots of pundits and researchers have called a bottom in real estate pricing over the last 2-3 years. Jon Gray kicked off the chorus in early 2024 when he said:
“Real estate values are bottoming.”
Jon Gray, January 2024
He wasn't wrong about the nominal bottom, but here's why it still doesn't feel like one. Real estate values are up about 1.5% since early 2024 per MSCI. Inflation is up 8.3% over the same stretch. That's a 6.3% decline in real terms.
Bottom line: Commercial real estate is stuck in the mud.
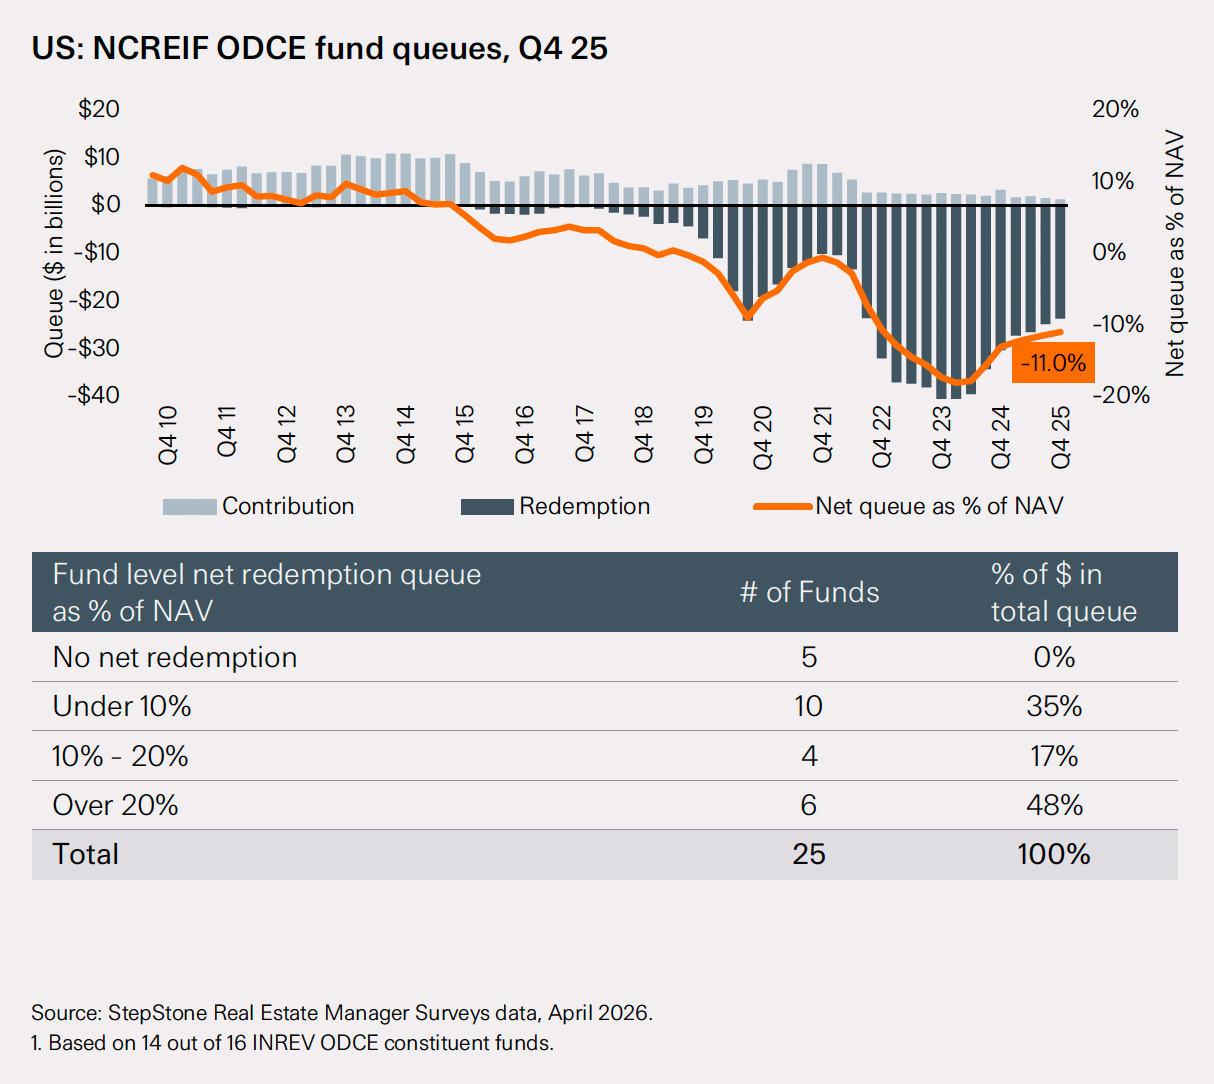
Core capital remains largely frozen because LPs don’t believe core funds’ carrying values and/or those values simply aren’t attractive relative to other opportunities.
“US core fund valuations do not reflect market cap rates.”
StepStone Group, Real Estate House Views, Spring 2026
And without core capital, there’s no one to accurately mark the safest assets. And no exit for everyone else, the managers who de-risk assets and expect to get paid for it.
Core funds only represent about $200 billion of equity, but they matter because they have the cheapest cost of discretionary capital. They try to be “risk off” in terms of speculation. They’ve historically generated 70%+ of their returns from income.
But the historically atypical interest rate environment between the GFC and the post-COVID hikes set core funds up to take just as much risk as anyone. Like banks that loaded up on 2% bonds, core funds were completely exposed to increases in long-term yield expectations. When the Fed stopped supporting the long-term bond markets, yields started increasing, and investors began to reevaluate their relative opportunities.
The subsequent devaluation of carrying values got a lot of attention, as did the valuation mechanics. Private funds have no other way to value their assets than to appraise them, and appraisals, by definition, depend on historical insights. Since carrying values trail perceptions of “real” values, core fund investors back up.
It’s hard to fully appreciate the before and after that core funds continue to work through without looking at what they were investing in when rates were still low. When “durable income” was the mantra.
So let’s take an uncomfortable but enlightening walk down memory lane.
Below is a list of ten investments highlighted in various core fund pitch decks between 2016 and 2022.
We leave off the fund and asset names because everyone makes mistakes. This isn’t about a deal or a platform. It’s about a sector trying to recover from an epic hangover after an extended ZIRP bender.
10 pre-peak core fund investments…
1. A big ultra-luxury bet
Timing: June 2016
Prop Type: Retail / Mixed Use
Market: Houston
Stabilized cap rate: 5.2%
Underwritten unlevered IRR: 6.4%
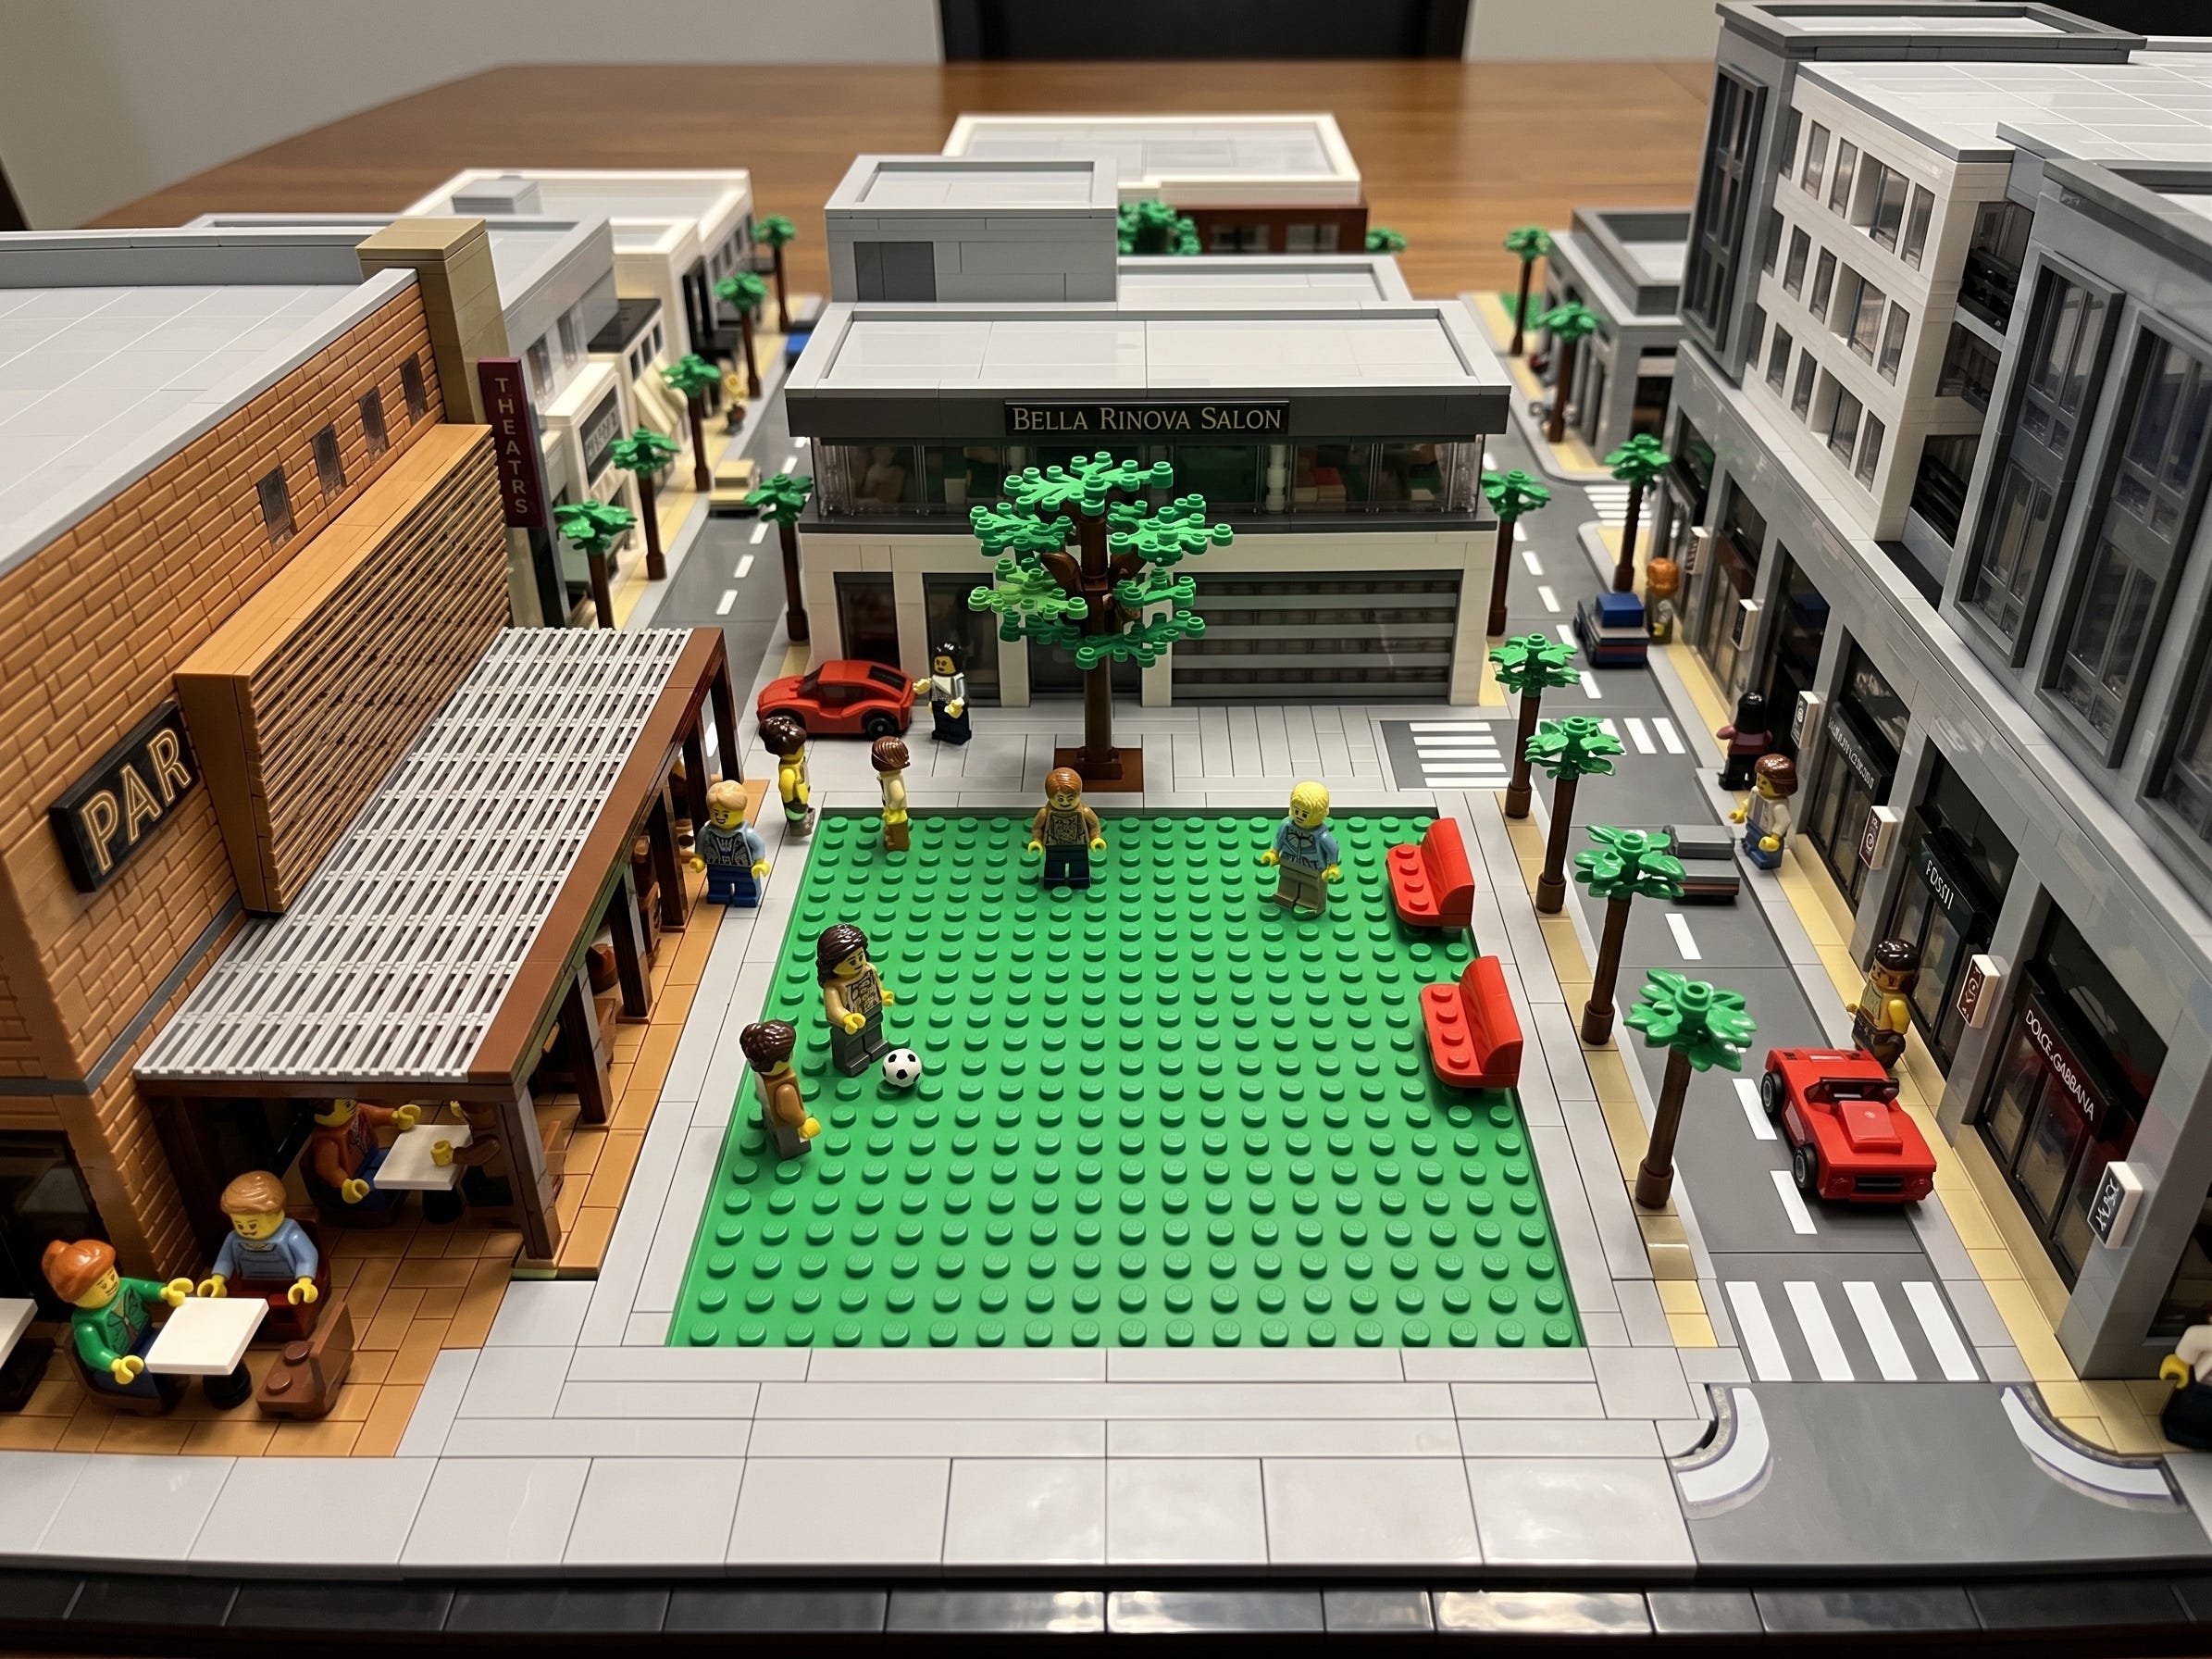
In the summer of 2016, one of the oldest and largest core funds invested in a soon-to-be-completed development in Houston. And although the property contained multiple uses, its value was highly dependent on luxury retail.
Nine luxury mixed-use buildings, roughly 370,000 square feet plus about 280 apartments, with some of the biggest names in luxury retail. A purchase price of $550 million. An oil bust and COVID's effects on retail hit this deal with a one-two punch, and the fund finally sold it in early 2024 for $450 million. Down 18% over eight years, before capex.
The fund’s approach revolved around a “low beta strategy,” and it was increasing its bets on urban lifestyle centers.
2. East Bay multifamily
Timing: September 2017
Prop Type: Apartments
Market: Pleasanton, CA
Going-in cap rate: 3.97%
Stabilized income return: 4.25%
Underwritten unlevered IRR: 6.07%
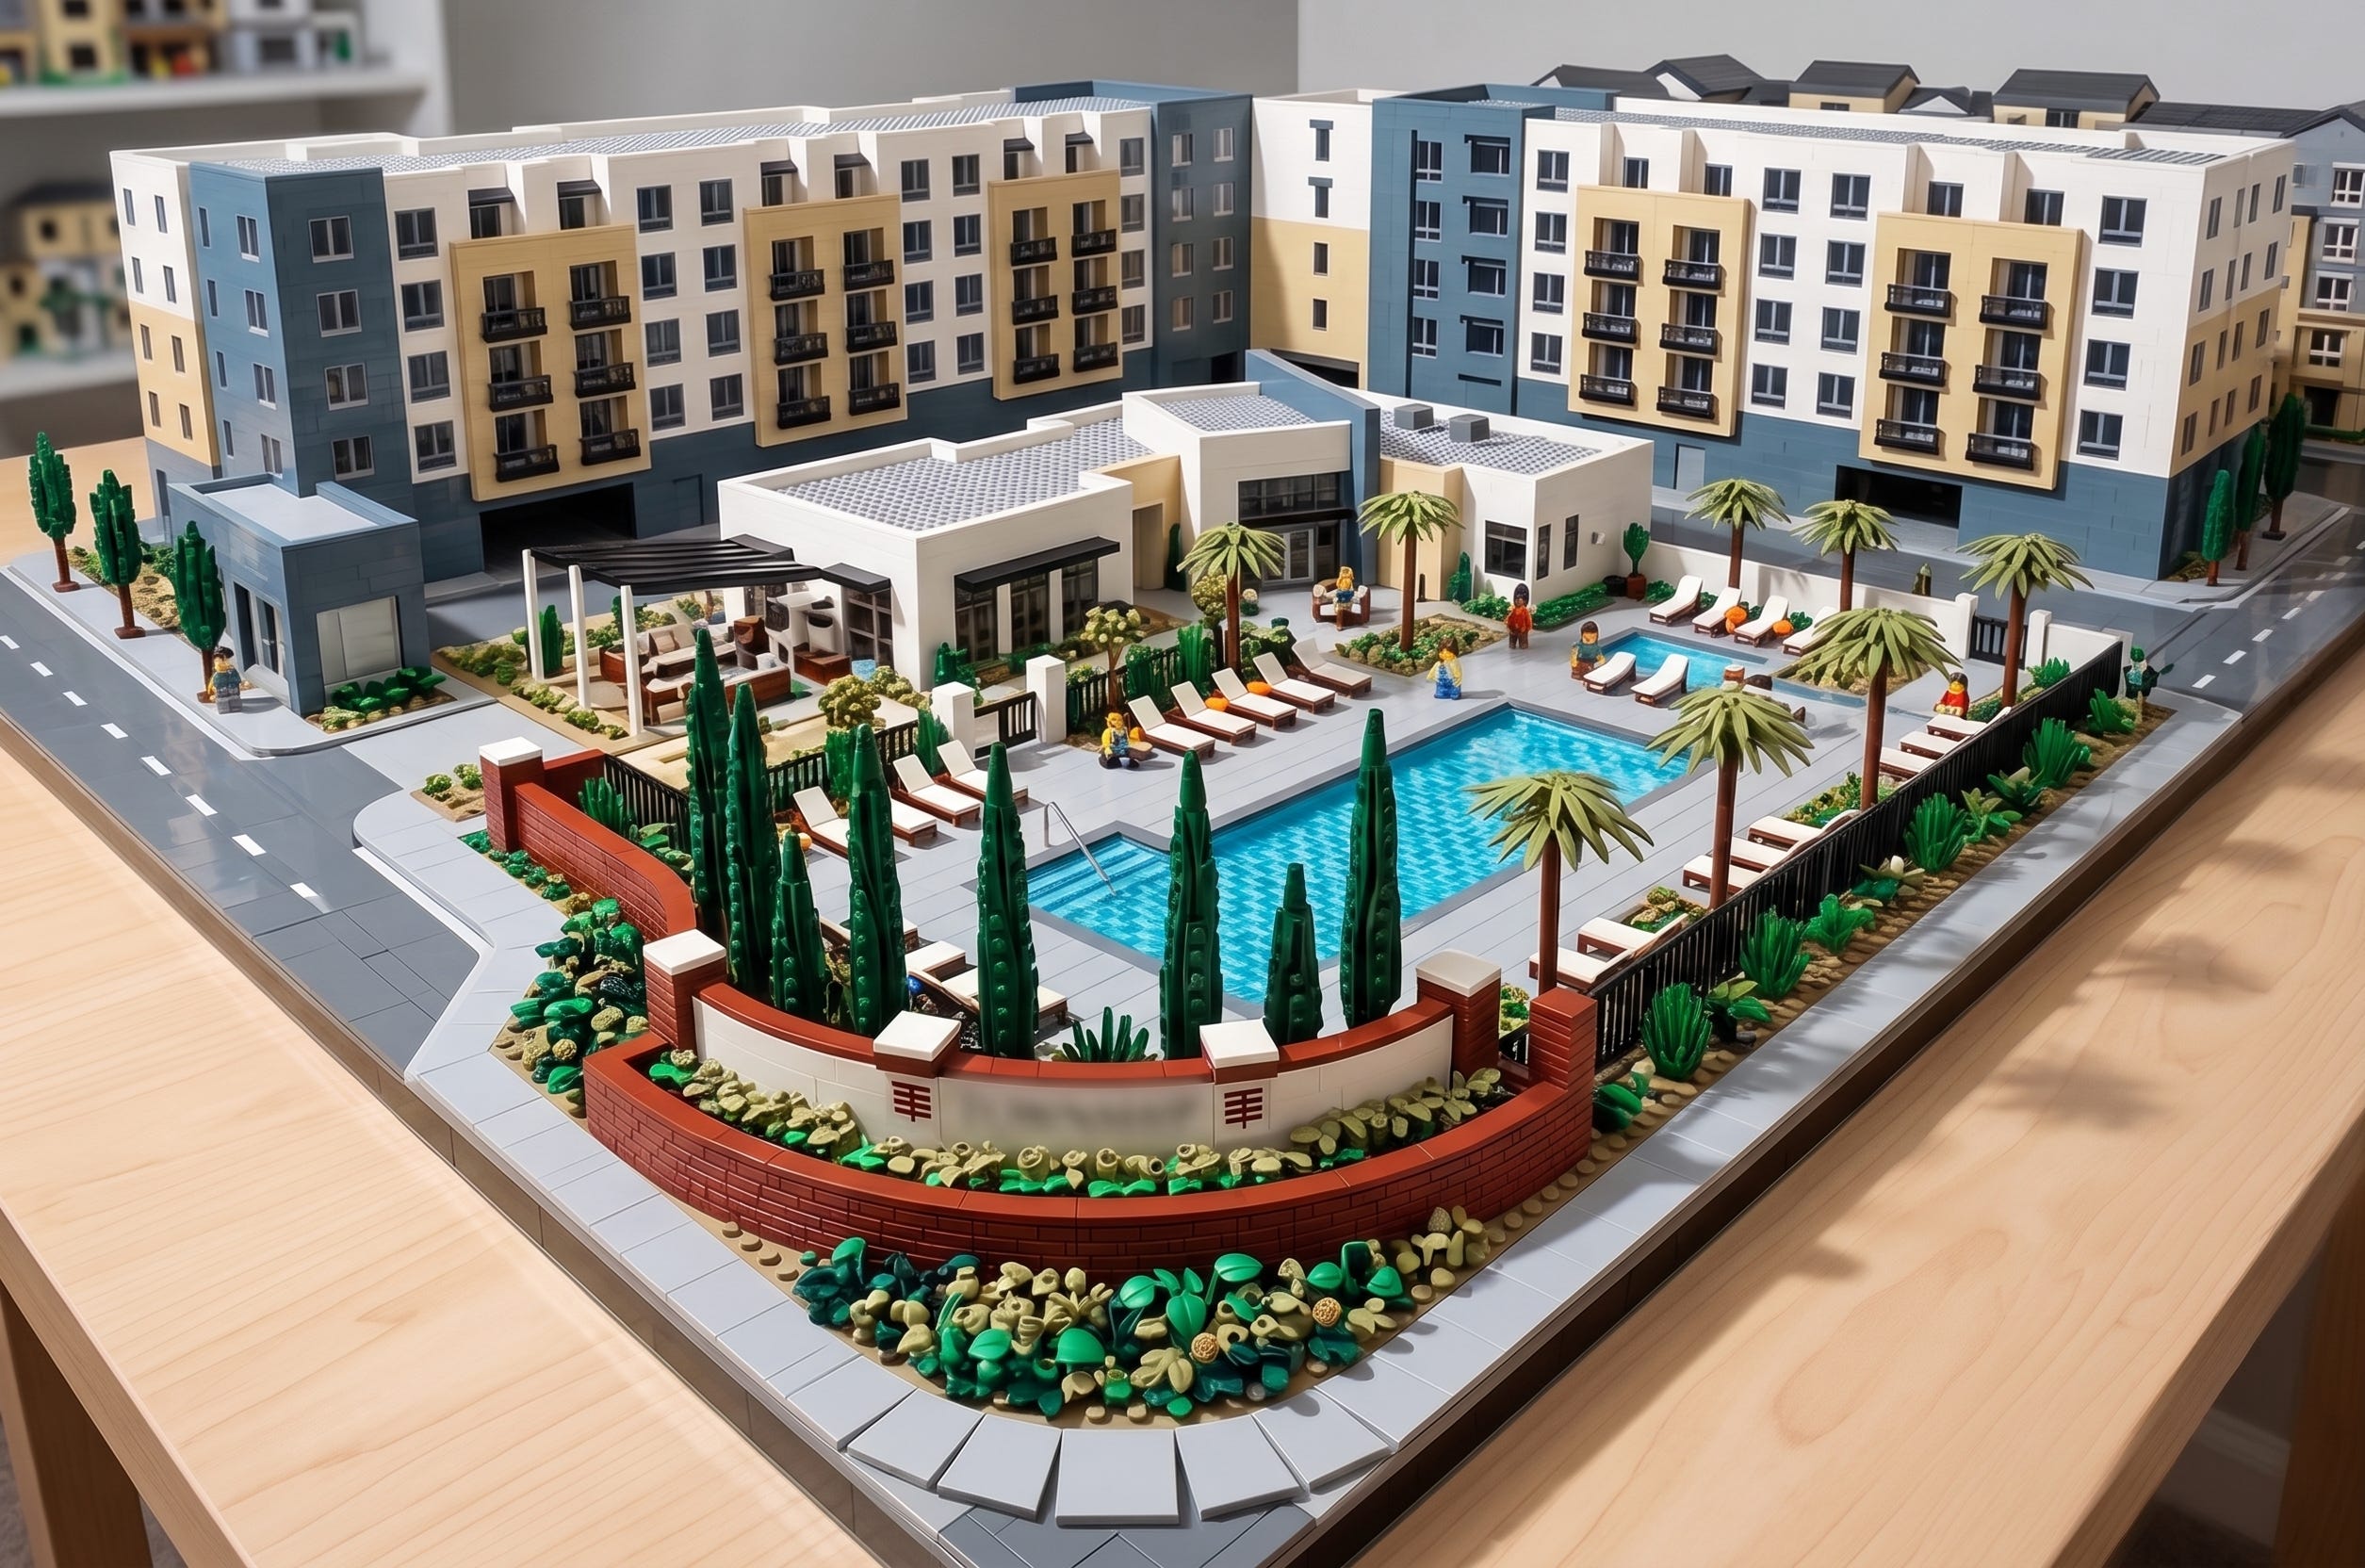
Another big core fund bought this East Bay apartment deal “approximately 15% below replacement cost.” What could go wrong? Answer: cap rate reversion.
3. Boston luxury high-rise
Timing: November 2017
Prop Type: Apartments
Market: Boston
Going-in cap rate: 4.1%
Underwritten unlevered IRR: 6.0%
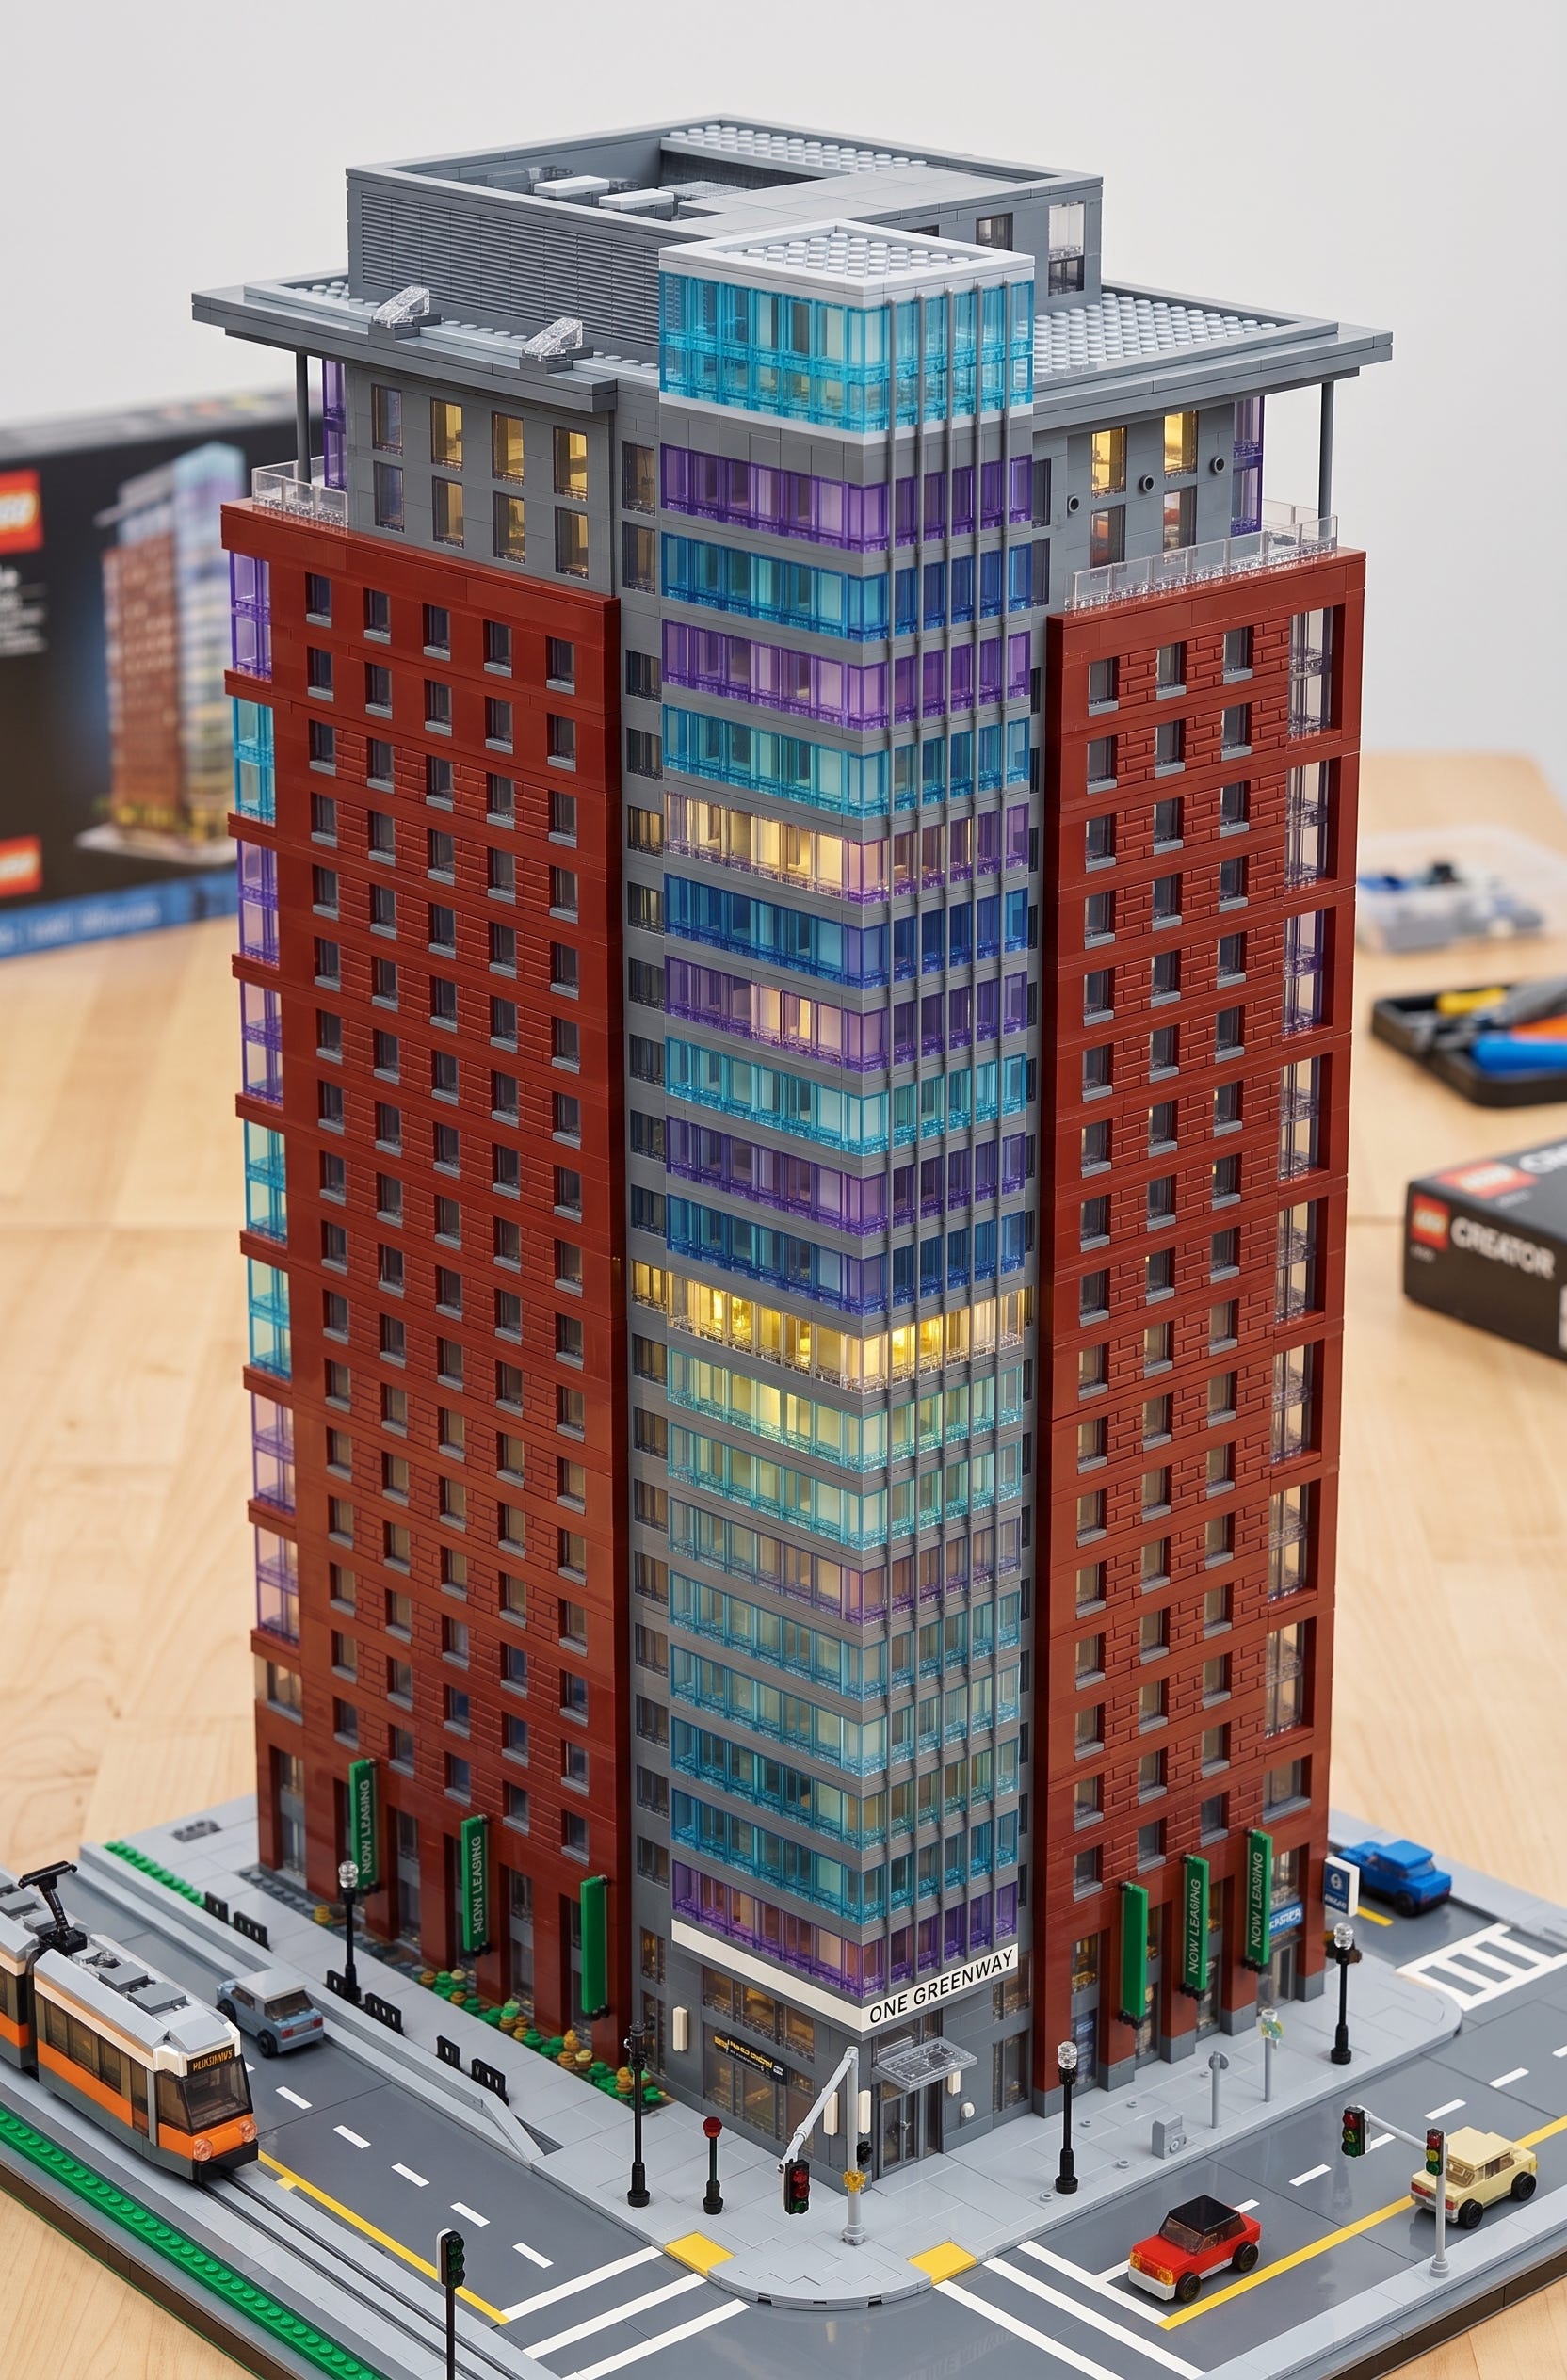
A two-year-old, 21-story Class A tower, 200+ units, 93% leased. $600k per unit with ground-floor retail and below-grade garage. How do you get from a 4% going-in to a 6% over a decade? Income growth and favorably low exit cap rates. Neither held.
Recent CRE Analyst deep dives for senior real estate decision-makers


4. NYC affordable housing
Timing: February 2018
Prop Type: Apartments
Market: New York, NY (Bronx)
Going-in cap rate: 3.2%
Underwritten unlevered IRR: 7.4% (5-year hold)

This deal was purchased in the last days of an enduring NYC multifamily myth: that hyper-low yields were justified because of a lack of housing supply, despite the heavy hand of regulation.
A 3.2% going-in and a 7.4% target means 420 basis points, well over half the total return, had to come from appreciation inside five years.
It was a bet that rent-regulated New York multifamily had a legislated growth path you could underwrite like a bond. Sixteen months later, the 2019 rent law rewrote that path.
The core fund and its operating partner sold the portfolio for $65 million in early 2023. So instead of a 7.4% unlevered and something north of 8% levered, they likely ended up around 3% unlevered and 2% levered, assuming capex and negative leverage outweighed any regulated income growth.
5. Another Boston high-rise
Timing: February 2018
Prop Type: Apartments
Market: Boston
Going-in cap rate: 3.9%
Underwritten unlevered IRR: 6.0%
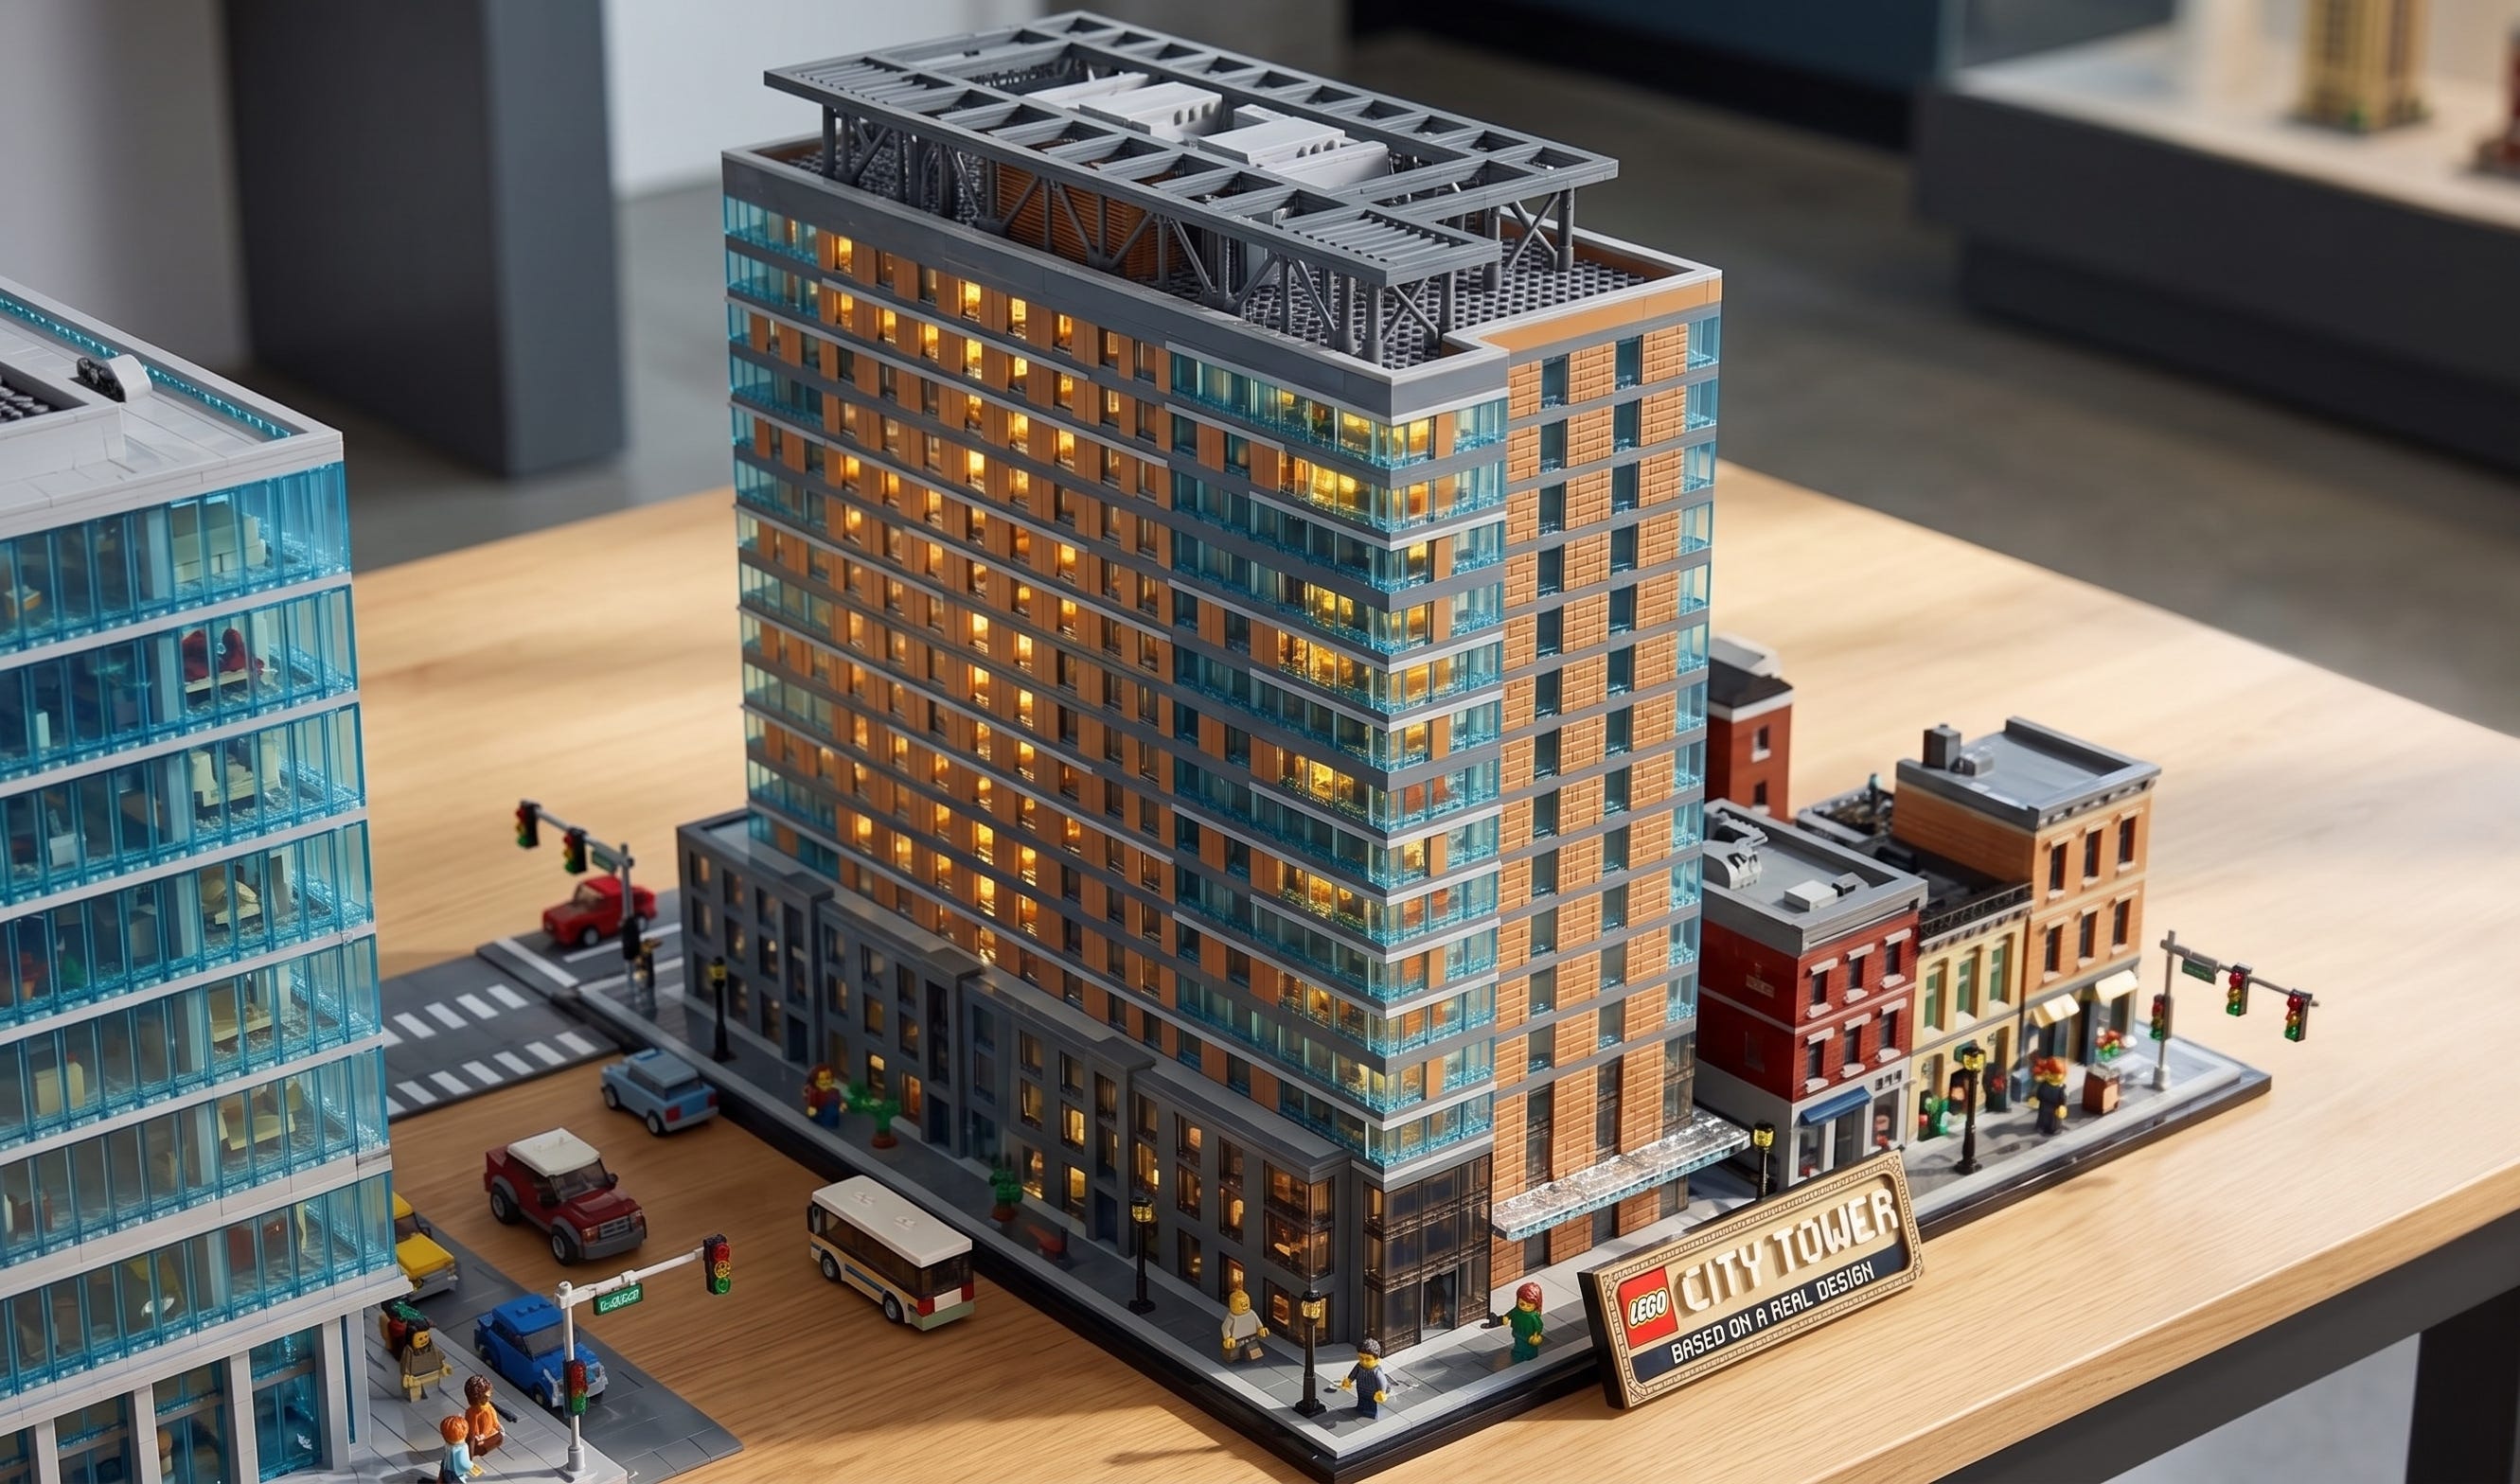
The same fund that bought the Bronx affordable portfolio above purchased this new, marquee asset in Boston around the same time. This was the largest of the fund’s $642 million of acquisitions that year, which had an average cap rate of 4.5% and a 6.8% target IRR. More than half the year's capital went into sub-4% cap rate coastal residential.
6. Trophy Boston office
Timing: Carrying value as of year-end 2017
Prop Type: Office
Market: Boston
Size: ~1.8 million square feet
Direct cap rate: 3.6%

The purchase was fine. By 2017, this core fund had owned the front-of-the-brochure, trophy office building for more than ten years. Built in 1989, it was an anchor of the Financial District at 95% leased.
But it was the fund’s largest asset at nearly $1.5 billion in carrying value, or $833 per square foot, representing 6% of the fund.
And about that carrying value: appraised cap rate of 3.6% with an unlevered IRR/discount rate of 5.5% and an anticipated reversion cap rate (in 2028) of 4.9%.
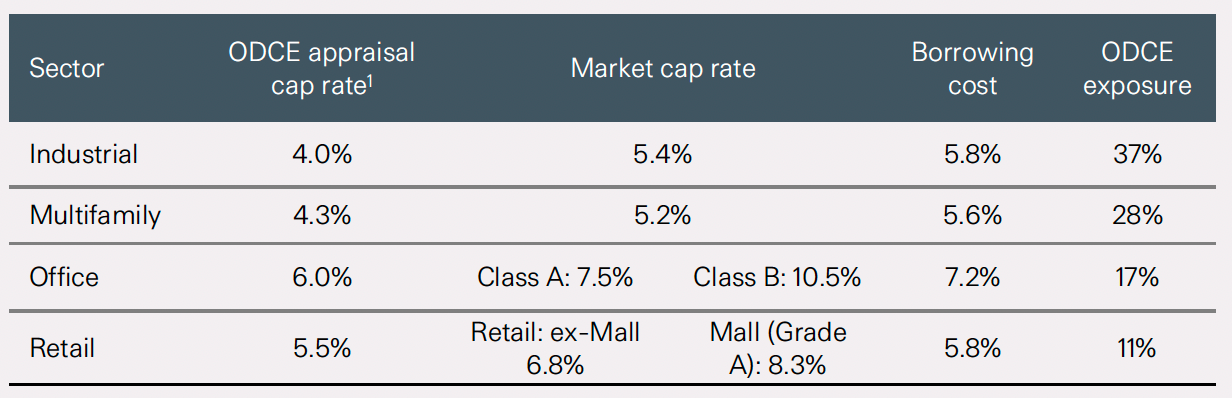
Those inputs might have been defensible in 2018. StepStone now pegs ODCE office appraisal cap rates at 6.0% against market cap rates of 7.5% for Class A and 10.5% for Class B. At year-end 2017 it was marked at 3.6%. It's ~75% leased today.
7. D.C. office
Timing: Carrying value as of year-end 2017
Prop Type: Office
Market: Washington, DC
Size: ~325,000 sf
Direct cap rate: 4.5%
Underwritten exit cap: 5.3%

The same core fund that owned the big Boston office building above also purchased this D.C. office building in 2015 at a 4.5% cap rate. A single tenant (big law firm) leased 72% of the building through September 2022. And, thankfully for this fund, it must have renewed since the building remains 86% leased in a 78% leased submarket.
Still, it’s hard to imagine those appraisal assumptions aged well. The $117 million mortgage that was reportedly assumed at acquisition carried a 5.73% interest rate, which likely didn’t age well with a 4.5% cap rate and minimal income growth.
8. Affordable San Francisco multifamily
Timing: May 2018
Prop Type: Apartments
Market: San Francisco Bay Area
Going-in cap rate: 3.2%
Underwritten unlevered IRR: 7.1%
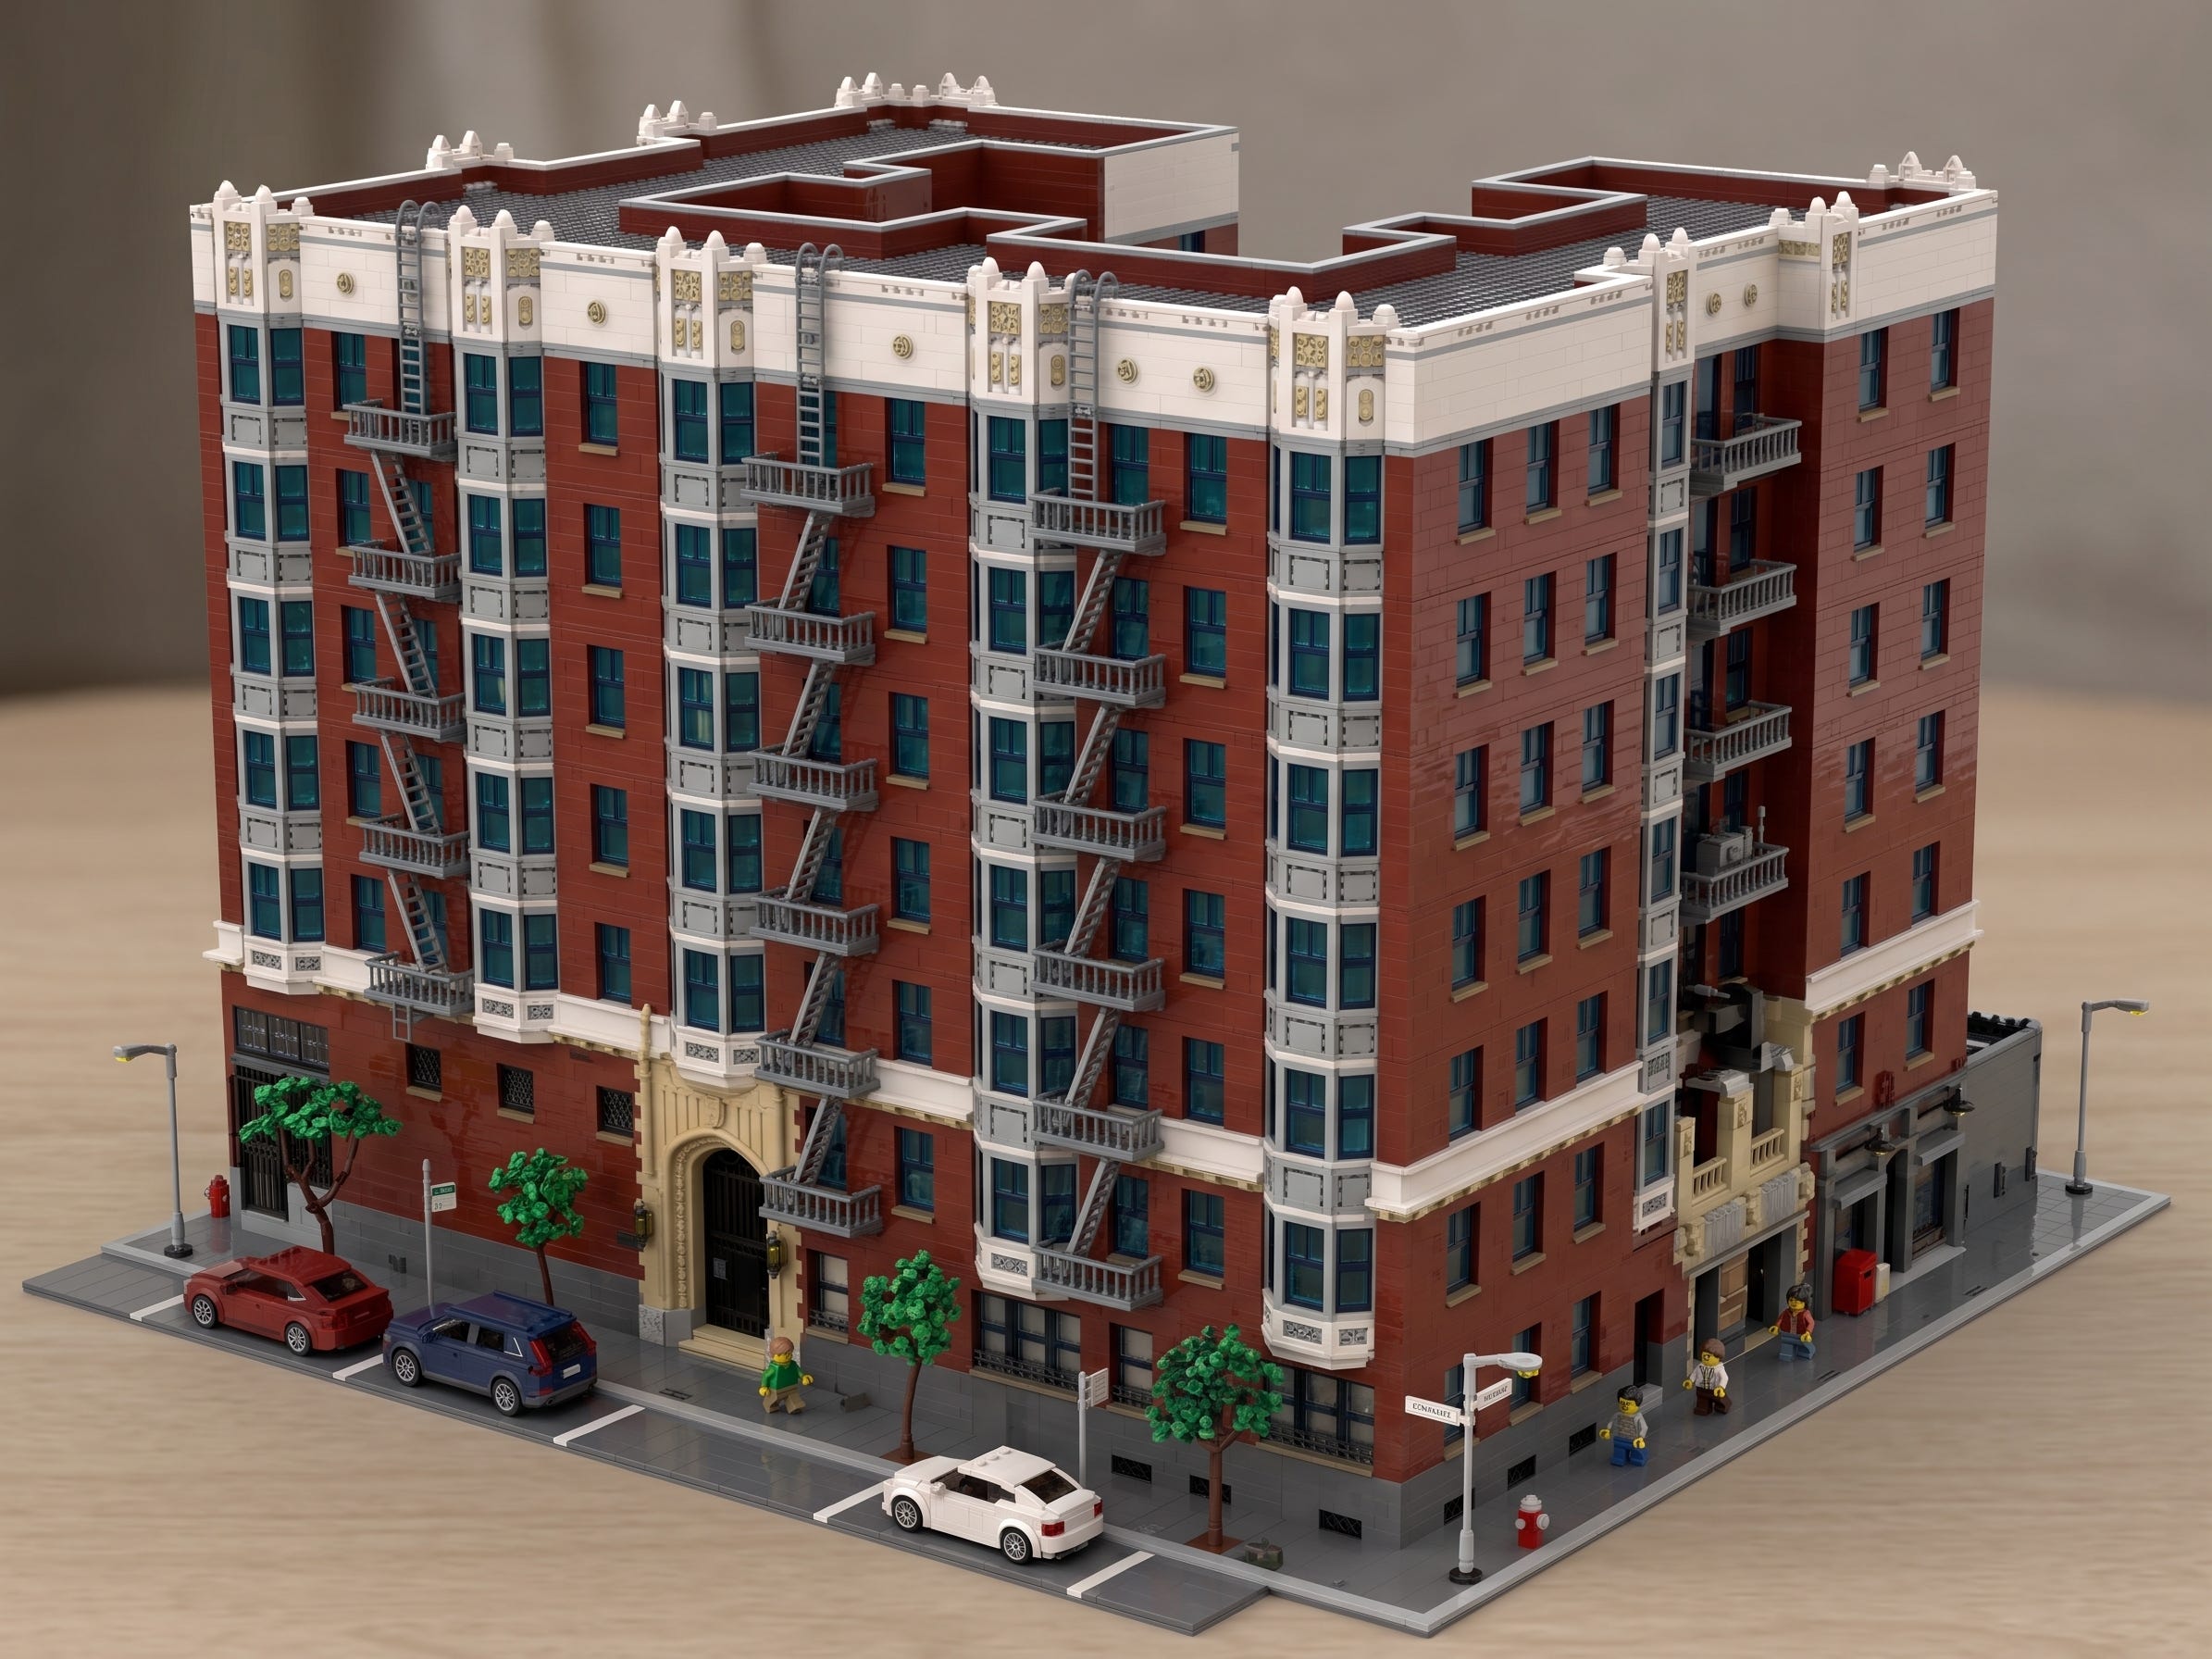
Very similar to the Bronx deal mentioned earlier. Same vintage/fund/yield. Opposite coast. Rent-controlled coastal multifamily underwritten as a legislated growth story rather than a yield, with 390 basis points of required appreciation stacked on a 3.2% coupon.
9. Yet another Boston high-rise
Timing: 2Q 2019 report
Prop Type: Apartments
Market: Boston
Going-in cap rate: 4.06%

A fully-priced high-rise multifamily acquisition under the header of “durable income,” which was accurate. Rents are up, and the property is still ~97% leased. But the going-in cap rate is about 50 bps below the 10-year Treasury.
10. NYC office
Timing: Carrying value as of 2Q 2019, purchased in June 2018
Prop Type: Office
Market: New York, NY
Going-in cap rate: 4.84%

Remember when creative office was cool? Another core fund acquisition presented under the heading “Core, Durable Income.” And, again, the label wasn’t wrong.
This office building remains 100% leased, but it sold in late 2024 for $85 million, 46% below the $158.5 million purchase price.
Durable income doesn’t always mean durable returns.
What the ten have in common
These were all good assets.
Trophy office. Marquee high-rise multifamily. The best luxury retail in a walkable environment. Rent-regulated apartments in New York and San Francisco.
Everyone thought these were safe plays.
That was the problem.
They were sold to investors as income, but every one of them depended on appreciation. A 3.2% going-in against a 7.4% target isn’t an income deal. It’s a bet on cap rates wearing a bond costume.
“Durable income” was accurate. Rents grew, buildings stayed leased, coupons got paid.
But durable returns were a different question.
How far is there left to go?
Here’s the uncomfortable part.
StepStone’s Spring 2026 report puts ODCE appraisal cap rates against market cap rates like this:
Industrial: 4.0% appraised vs. 5.4% market
Multifamily: 4.3% vs. 5.2%
Office: 6.0% vs. 7.5% (Class A)
Retail: 5.5% vs. 6.8% (ex-mall)
That’s at least a ~20%+ gap, which is what LPs are looking at. It’s why LPs are stacked in exit queues and why the shadow queue could be even greater.
And the competition got a lot better
Cap rates and discount rates are only half of this story. The other half is what allocators can buy instead.
Here’s a slide from Walton Street’s Real Estate Debt Core Fund1 pitch deck:
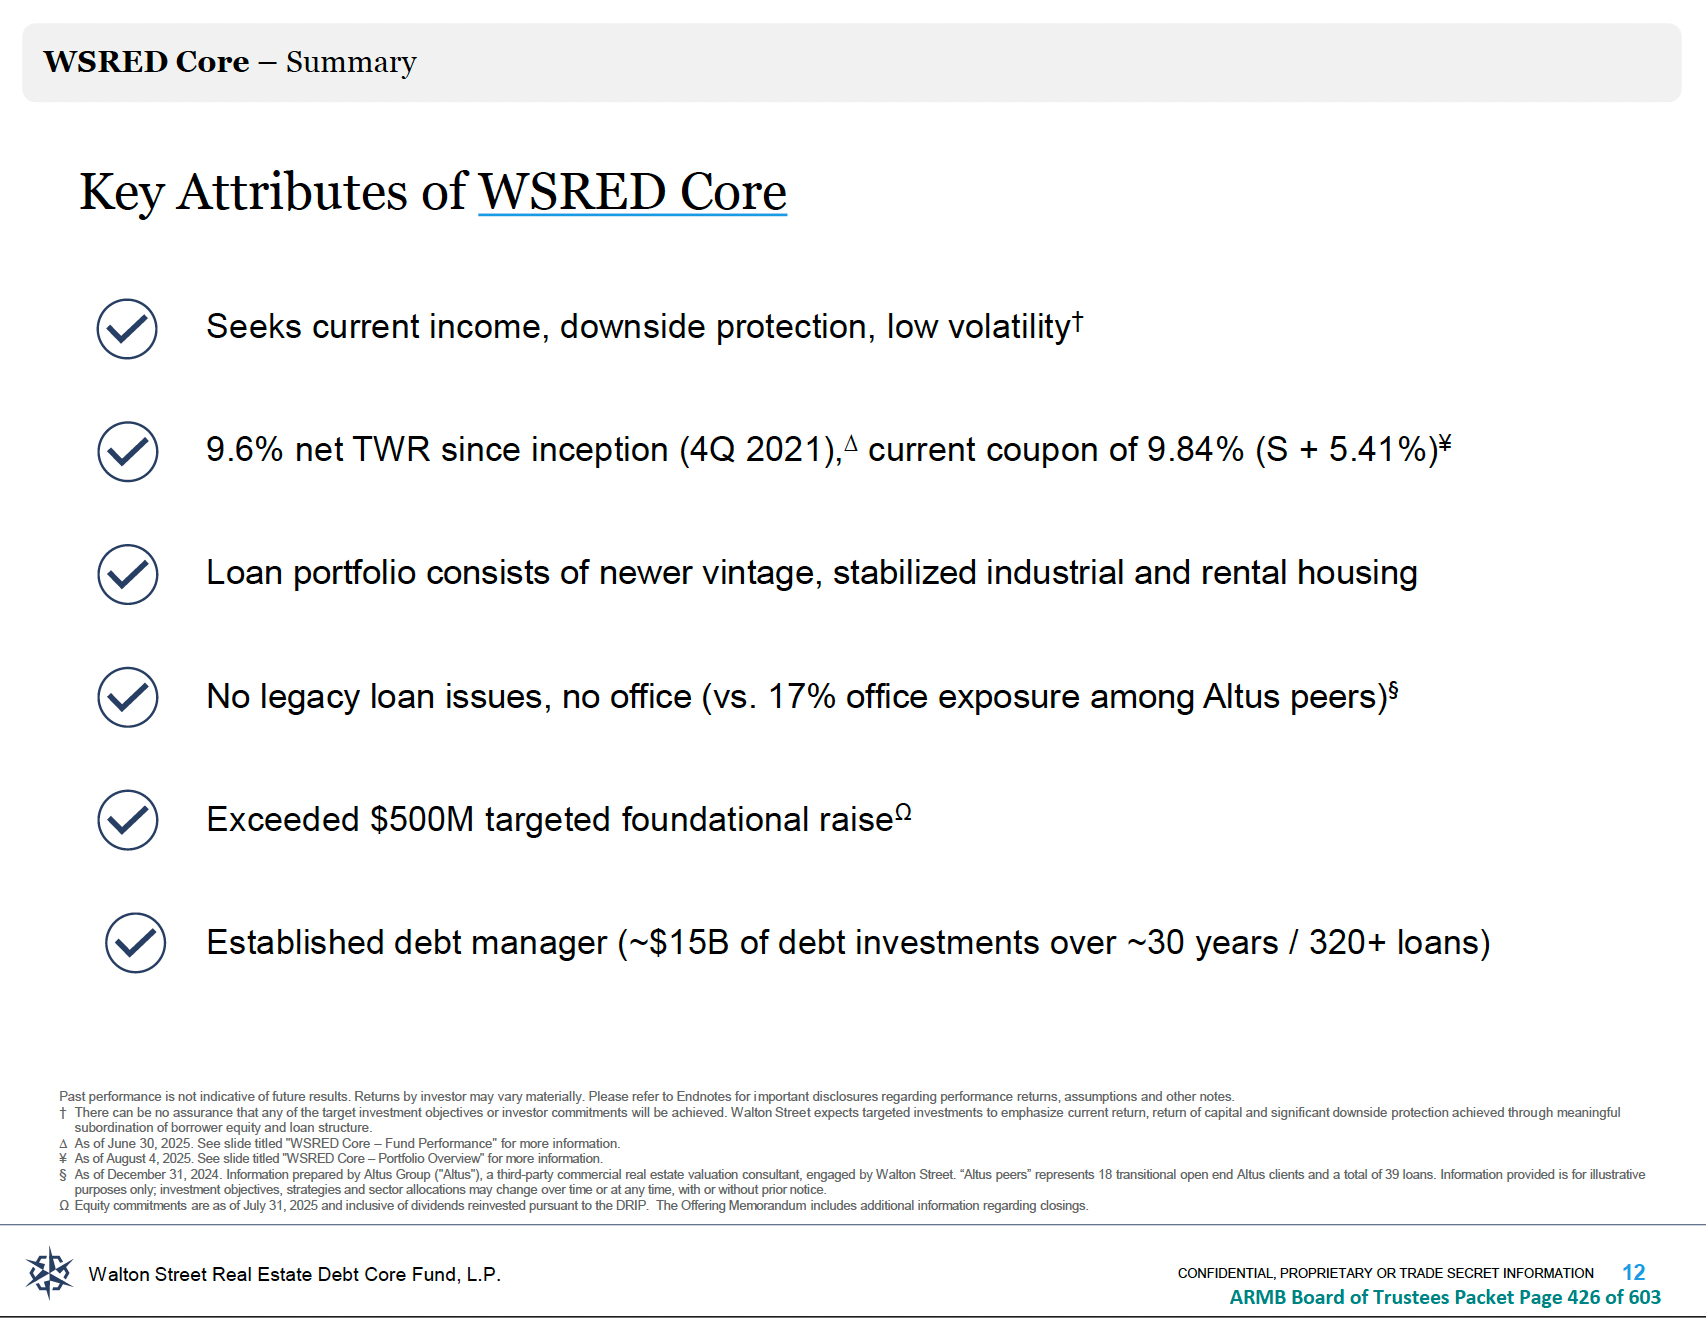
Headline takeaways from Walton Street’s pitch:
9-10% returns.
One hundred percent current pay.
Holds 50% to 65% LTV strip and sells the senior piece off.
Collateral: multifamily, student housing, industrial.
No office.
And Walton Street isn’t an outlier. KKR’s latest real estate credit fund targets 9% to 12% net, three quarters of it senior loans. PIMCO’s second commercial real estate debt fund targets 8% to 10% net at 60% to 75% LTVs.
We said earlier that core funds historically generated 70%+ of their returns from income. The debt funds are at 100%.
This presents allocators with a tough decision for their real estate capital:
Own apartments at a 4.3% appraised cap rate and hold the first loss position; or
Lend against the apartment buildings at 9.8%, paid in cash every quarter, with a 30-40% buffer from devaluation.
There’s a lot more that goes into this comparison, but it’s hard to get to the details when the headline risk/return story is so differentiated.
So what unfreezes it?
Three paths…
Core fund markdowns. Seems unlikely, but core funds could take big writedowns, offering new investors a more reasonable deal at the expense of current investors.
Income growth bridges the gap. Core returns get better at today’s markets when income grows, but it’s a slow-moving solution.
The alternative gets worse. Spreads compress, SOFR falls enough, and/or unexpected credit events pull that 10% to a 7%.
Values are up 1.5% since Jon Gray called the bottom. Down 6.3% after inflation.
This feels more like a standoff than a bottom.
PS - We left the names off, but you can find every one of these deals in about ten minutes. That isn’t the point. The point is that the most conservative, best-resourced, most process-driven buyers in the industry all made the same bet at the same time.
PPS - If you’re wondering why value-add and opportunistic capital can’t get moving either, this is it. The core bid is the exit. No exit, no entry. Also, non-core capital has its own standoff that will become more apparent as the megafunds from 2018-22 get closer to their targeted end dates.
We name the debt funds because we’re not highlighting their mistakes. Sharing them isn’t an endorsement. We do not provide investment advice.
Your valuation point is one of the best points throughout the article. One of the best examples of this is if you look at traded versus not traded REIT pricing. It’s a shockingly stark contrast… gonna be difficult for any new investor to justify buying into a non traded REIT right now.
I get that debt is a very competitive profile, but if there’s minimal equity chasing deals, there’s no transactions for the capital now chasing debt.